

The Hidden Revenue Driver in Theme Parks: Ride Throughput
Visitor and queue wait time technology is often perceived as a guest experience tool. When leveraged correctly it’s a capacity multiplier, and it’s one of the highest ROI investments a park can make. Forward-thinking amusement parks are now using it to their advantage in 2025.
17 JUL
Blog
4 min read
Most technology aimed at improving revenue in the amusement park industry depends on changing guest behaviour, spend more, stay longer, upgrade your ticket.
After working with several high-volume amusement parks around the world, there’s one strategy and set of metrics that we’ve uncovered that can reliably increase revenue within a week, without asking anything of guests or investing significant amounts into marketing.
And that is being able to accurately track queuing behaviour, and ride throughput performance (seat fill, departure rates and utilisation).
Not just to reduce shorter queues and manage expectations, but to expose and optimise how many people your park can process per day, especially with premium ticket passes for fast lanes.
Parks that regularly experience long queues and high volumes of visitors will gain the quickest benefit financially by implementing the below strategy.

Representation of a ride with partially empty seats
Throughput is Revenue
Throughput =
(Dispatch Time (sec) 3600 × Operating Hours (hr) × Seats per dispatch × Load Factor × Utilisation
Throughput one of your park’s true revenue engines. If demand is strong, the only thing that limits how much you earn is how efficiently you process it, and that comes down to two controllable factors: Dispatch rate and seat fill.
Every time a dispatch is delayed or a seat goes empty, you’re leaving revenue on the table.
Optimising these two levers is the fastest way to increase ride capacity and overall spend.
Example: Throughput Calculation for a 24-Seat Roller Coaster
Let’s say you’re running a roller coaster with these performance metrics:
-
Dispatch Time = how long it takes for 1 ride cycle: 120 seconds
-
Operating Hours = total time the ride is operational in 1 day: 10 hours
-
Seats per Dispatch = how many riders can board each cycle: 24
-
Load Factor = how full each dispatch on average actually is: 85%
-
Utilisation = how many dispatches actually can happen, accounting for delays or downtime: 90%
Calculations
-
Dispatches per Hour: 3600 seconds (1 hour) ÷ 120 seconds (dispatch time) = 30 dispatches/hour
-
Total Dispatches per Day: 30 dispatches/hour × 10 hours = 300 dispatches/day
-
Total Rider Slots (Before Efficiency Losses): 300 dispatches × 24 seats = 7,200 rider slots/day
-
Adjust for Load Factor: 7,200 × 85% = 6,120 riders/day (accounting for empty seats)
-
Adjust for Utilisation: 6,120 × 90% = 5,508 actual riders/day
What does this show us?
Even with strong demand, you’re only getting 5,508 riders per day through this roller coaster. That’s nearly 1,700 riders short of the coaster’s theoretical max of 7,200 per day, a 23.5% loss in capacity. This isn’t caused by the ride system. It’s caused by empty seats and missed dispatches, two areas where operators can make a measurable impact with the right tools.
Operational Gains Go Further Than Revenue Alone
The benefits of monitoring ride departure rates, seat utilisation, and throughput extend well beyond immediate revenue gains.
At a strategic level, improvements in these metrics can:
-
Reshape training protocols and operations procedures
-
Directly improve guest satisfaction KPI's (e.g., rides per guest, time in queue)
Enable either:
-
More rides per guest → supports higher ticket pricing
-
More guests per day → capitalises on latent demand
-
Or both simultaneously
These dynamics increase per-capita spending and drive sustained revenue lift, without resorting to behavioral manipulation or marketing spend.
Smart Scaling on Low-Volume Days
Higher throughput efficiency doesn’t just improve peak-day performance, it also creates strategic opportunities on quieter days. On low- to mid-volume days, better operational efficiency lets you down-spec throughput without impacting guest experience.
This means you can hold select units (trains, cars, gondolas) off-track while maintaining service quality, such as:
-
Less daily setup time (fewer safety checks and shorter crew prep)
-
Reduced wear and tear on heavy equipment
-
Longer asset life supported by smoother preventive maintenance cycles
-
Lower reactive maintenance through balanced unit rotation
It’s like managing a car fleet: drive less, maintain less. Over time, this approach can significantly reduce costs.
With maintenance expenses for a single ride often reaching $100K–$200K annually, even modest efficiency gains deliver meaningful ROI helping offset some of these costs.
Example: One Ride, One Fix, One Big Result
This year one of our customers deployed Nola to track dispatch performance and seat utilisation, with no ride system integration required.
Take a typical high-capacity coaster:
-
24 seats per dispatch
-
Dispatch every 90 seconds
-
Operates 10 hours per day
-
Load Factor = 85%
-
Utilisation = 90%
Riders/day = (3600 ÷ 90) × 10 × 24 × 0.85 × 0.90 ≈ 7,344
New riders/day ≈ 8,208 → +864 riders/day
If 10% of those buy Fast Pass at $60:
Revenue gain = 864 × 10% × $60 = $5,184/day
100 days = $518,400
All from a single operational improvement
Now improve Load Factor to 95% using real-time batching and staffing feedback:
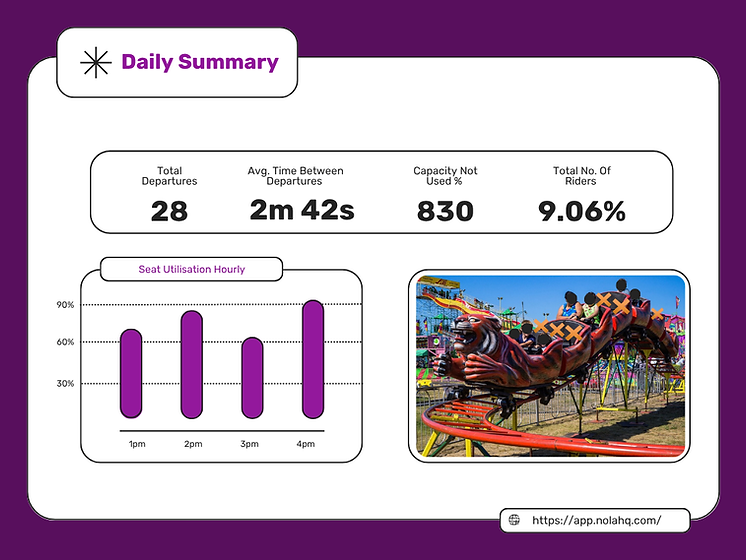.png)
Sample Dashboard
Final Thoughts
Your revenue ceiling isn’t set by how many guests want to attend, it’s set by how many you can physically serve.
Using crowd analytics technology like Nola to monitor queue wait time behaviour, and ride throughput performance will help you:
-
Fill every seat
-
Hit every dispatch
-
Serve more guests
-
Unlock real revenue
BOTTOM LINE: Optimise what you already control, it’s the most reliable way to grow.
Thanks for reading! Nola offers a Ride Operations Optimisation Management solution for high capacity, high volume amusement parks, enabling them to uncover more revenue from their existing inventory.